

Stimulating eco-friendly living in Delft through gamification
-
Client
The Platform Energie Transitie Delft is a foundation for and by citizens of Delft, connected to the municipality, that strives to reduce the city’s CO2 footprint and to get people to live more eco-friendly.
-
Target audience
The target group consists of the citizens of Delft with the aim of informing them and getting them to more actively reduce their CO2 emissions.
-
Problem statement
The Platform EnergieTransitie Delft wants to engage the citizens of Delft to take action in reducing their CO2 emissions. Additionally, they want a visualisation of CO2 emissions in the neighbourhoods of Delft. Currently, citizens of Delft are not fully aware of (their individual) CO2 emissions. They are disengaged and unaware, because they’re lacking incentives to take individual steps towards reducing their carbon footprint.
-
My role & responsibilities
Throughout this project my main role in the team was that of the Scrum Master. As Scrum Master it was my job to maintain contact with the client and mentor, as well as ensure that every Scrum session went according to plan and time schedule. This often meant that I had a steering and supporting role. In this role I tried to make sure that people always felt comfortable giving each other feedback, and that everyone was able to work on what they wanted to work on the most, while keeping in mind the needs for the project.
-
Scope & constraints
The project took place during a 15 week period. During this period we spent around 3 days per week on this project. We started off with a 3-week sprint 0 to orient ourselves with the project and do some preliminary research. We then had three 3-week sprints in which we did more research and design work, as well as prototyping and testing with users. Finally, we had another 3 weeks left, which were used to polish up the design and prepare for the final presentation to the client.
-
Context
This was the first time I worked with Scrum and while taking a more Agile approach to UX design. This meant that during sprint 0 and sprint 1, we were still figuring out how to set everything up efficiently.
Process
Sprint 0
In the first couple of weeks, we began with orienting ourselves on the topic and doing some preliminary research. We researched ways to visualise data, ways to get the relevant data, psychological methods and theories regarding persuasion and nudging and finally gamification and rewards systems.
We also already came up with one concept per person. My idea was a type of social media app, where people could upload and share their activities regarding CO2 emissions. People would be able to stimulate each other and learn from each other. A second part was a map that shows Delft as a forest. Where each household was represented by one tree. The vitality of that tree was a metaphor and a visualisation of how well that household was doing with regards to reducing their CO2 emissions. And when zoomed out, the denser parts of the forest where the trees are the biggest are the areas that are doing the best.
For the rest, these first couple weeks were used to set up our Scrum method, divide roles and contact the client.
At the end of sprint 0, we combined several of our concepts and presented them to the client. He ended up preferring a concept that provides reachable and measurable CO2 reduction challenges and that offers the user rewards for completing them. Because we thought that showing progress in a visual way would also stimulate users to reduce their CO2, we decided that we also wanted to include a visualisation of these emissions. Thus we also included that part of my own concept.


This product vision board helped guide and was used as a design vision throughout the project.

A collection of all of our How-Might-We (HMW) questions. They were placed on a C-grid based on the difficulty to implement and whether they relied on internal or external motivation types.
Sprint 1
The goal for the first sprint was to get used to Scrum and Agile and to create a minimum viable product (MVP). For this MVP we wanted to have the first draft of a rewards and challenges page, a competition page and a visualisation of CO2 emissions page ready. We still had to get used to assigning points to user stories and estimating how much time one user story would take to complete.
I also researched ways to create competition and how to show progression with several achievements or challenges like in video games.
At the end of the sprint, we had a first design for a leaderboard page, as well as what the view of the map of Delft could look like, and what a map of the Netherlands would look like. This overview was added to give more context to the data on a national scale.
We were not able to make the challenges and rewards page yet and left that for the next sprint.


Sprint 2
In the second sprint, we aimed to continue the design by creating the challenges & rewards pages as well as creating the onboarding process for the app. A second goal for this sprint was to get started on user testing, as we were not able to get to that in the first sprint.
For the onboarding of the app, we created a small tutorial guide that explains what the app is meant for and how the users could use it. We also created a sign-up and sign-in process.
For the challenges and rewards pages, we decided to work with a card-like overview of all of the challenges, as well as the rewards. This created a visual coherency between the different pages.
User testing was done with people we knew personally. I tested the prototype with several housemates who all gave interesting feedback. In terms of the visual vibe of the app, most of them said they really liked it. Everyone also shared the opinion that the app was aimed at solving an actual problem and saw the use of the app.
Two people, however, mentioned that it seemed to them that they could pretty easily abuse the app by not really completing the challenges. They were worried that there would not be a good way to make sure people actually complete the challenges, and thus it would be too easy to claim the rewards.
-

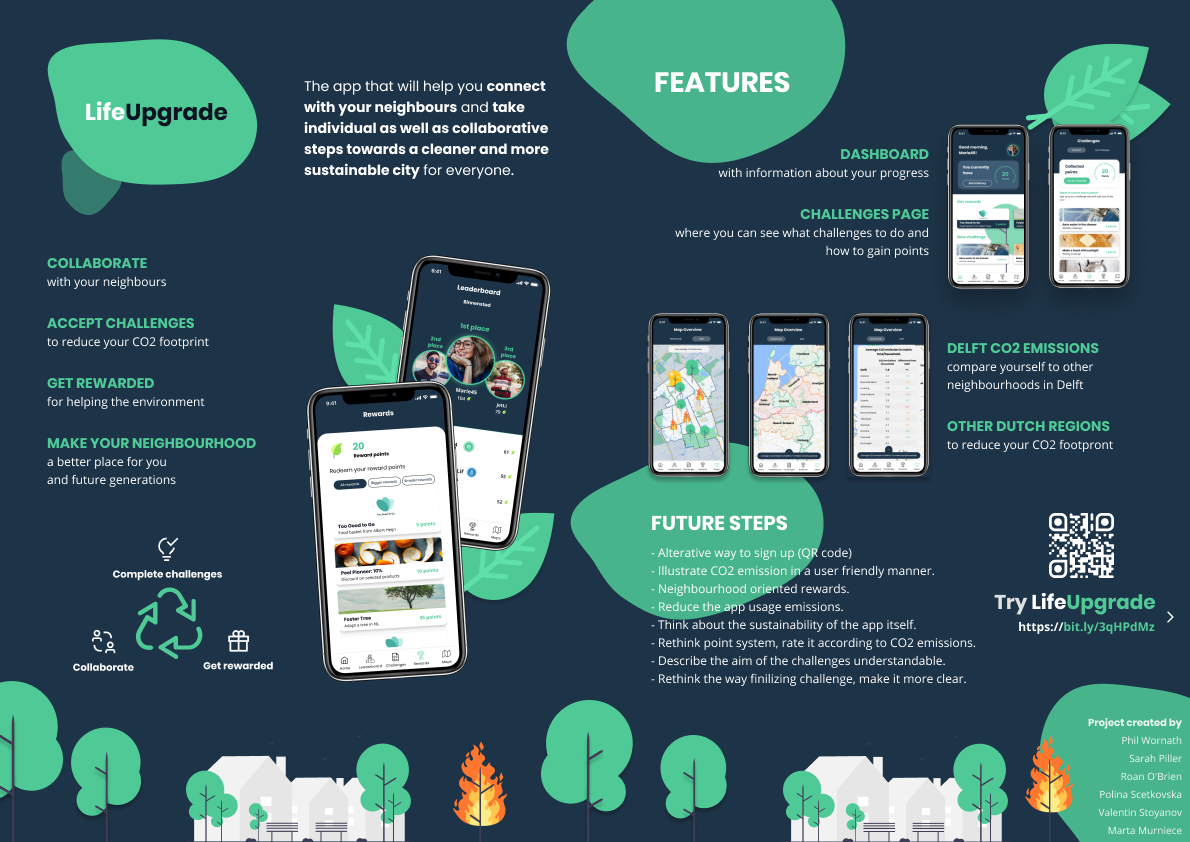
On the home screen, the user is shown an overview of the challenges they can work on, some rewards waiting for them, and their progress (shown in the number of points they have earned).
-

Two maps are used to give some more context to how the user is doing compared to their surroundings. The map of Delft shows how each neighbourhood is doing on average. The map of The Netherlands shows how each region is doing. The shape, size and colour of the trees give an indication of how well the area is doing. The bigger the tree, the better that area is doing in terms of reducing its CO2 emissions.
-

The app provides a set of challenges for the user to complete. These challenges help reduce the user’s CO2 emissions as well as stimulate the user to think about the waste they produce.
Sprint 3
One of the goals of the third and final sprint was to do more user testing, preferably also with random people living in Delft. Besides that, we wanted to also iron out mistakes from the previous testing, as well as improve the overall flow of the app.
Based on the user testing, the onboarding process was cleaned up a bit by reducing the number of screens used in the tutorial and by removing the names of the districts in Delft.
Another change we made due to the user testing was the colour of the map of the Netherlands. Some users voiced their concerns about the legibility of the map, so we changed the colours to increase both legibility (through more contrasting colours) and consistency with the map of Delft.
We also added some pop-ups with one-time explanations of parts of the app, because some people were still confused by some of these things, such as the meaning of the various tree sizes on the map of Delft.
Finally, we also expanded on the challenges and rewards pages by adding various different challenges and rewards to give a better idea of what these types of things could be.
Walkthrough video
This walkthrough video shows a complete overview of all of the things the app has to offer. From completing challenges to getting rewards, and seeing how well various parts of Delft and The Netherlands are doing in terms of their CO2 emissions.

Outcomes and lessons
The client liked our final design, and thought it looked very professional. And while he acknowledged the struggles of finding testing participants during a pandemic, it would have been interesting for him to see whether our design would actually stimulate people to live more eco-friendly.
The main thing I learned through this project was how to work in an Agile way and how to work with Scrum, as I had not done that before. Throughout the first 2 sprints, I was still quite unconvinced by the benefits of going through the entire Scrum process, but towards the end of the project, I started seeing the merits and began understanding how the design sprints should be set up to make it more useful than a regular waterfall approach.
I also learned that to make the best use of a Scrum process, it is best to focus on the minimum viable product straight from the beginning, so that user testing can be incorporated from the start as well. During this project, we tried to do too much during the first sprint, which meant we didn't have enough time to test the design with users.